Dubai Property Market
The Key Market Figures
Dubai property sales activity in September 2026, including DLD and DIFC sale transactions.
11,288
Sales Volume
▼ 6.1% MoM
▼ 44.4% YoY
AED 1,650
Median Price / Sqft
▼ 2.0% MoM
▼ 2.4% YoY
AED 29.4B
Sales Value
▲ 2.9% MoM
▼ 45.8% YoY
Includes DLD and DIFC sale transactions. Excludes mortgage
registrations and gift transfers.
Transaction Breakdown
Transactions by Property Type
September 2026 sales activity across apartments, villas, commercial properties and plots.
| Type | Volume | MoM | YoY | Sales Value |
|---|---|---|---|---|
| Apartments | 9,055 | ▼ 9.7% | ▼ 47.6% | AED 14.8B |
| Villas | 1,428 | ▲ 3.9% | ▼ 32.7% | AED 8.6B |
| Commercial | 539 | ▲ 27.7% | ▲ 5.3% | AED 2.2B |
| Plots | 237 | ▲ 28.8% | ▼ 37.1% | AED 3.8B |
| Total | 11,267 | — | — | AED 29.4B |
Market Read
September market momentum was uneven — and that matters.
Transaction activity remained mixed across Dubai’s property market in September, with apartments recording lower sales volume while villas, commercial properties and plots showed stronger month-on-month activity.
Sales Activity
Monthly Sales Volume Trend
Monthly sales transactions, October 2025 – September 2026.
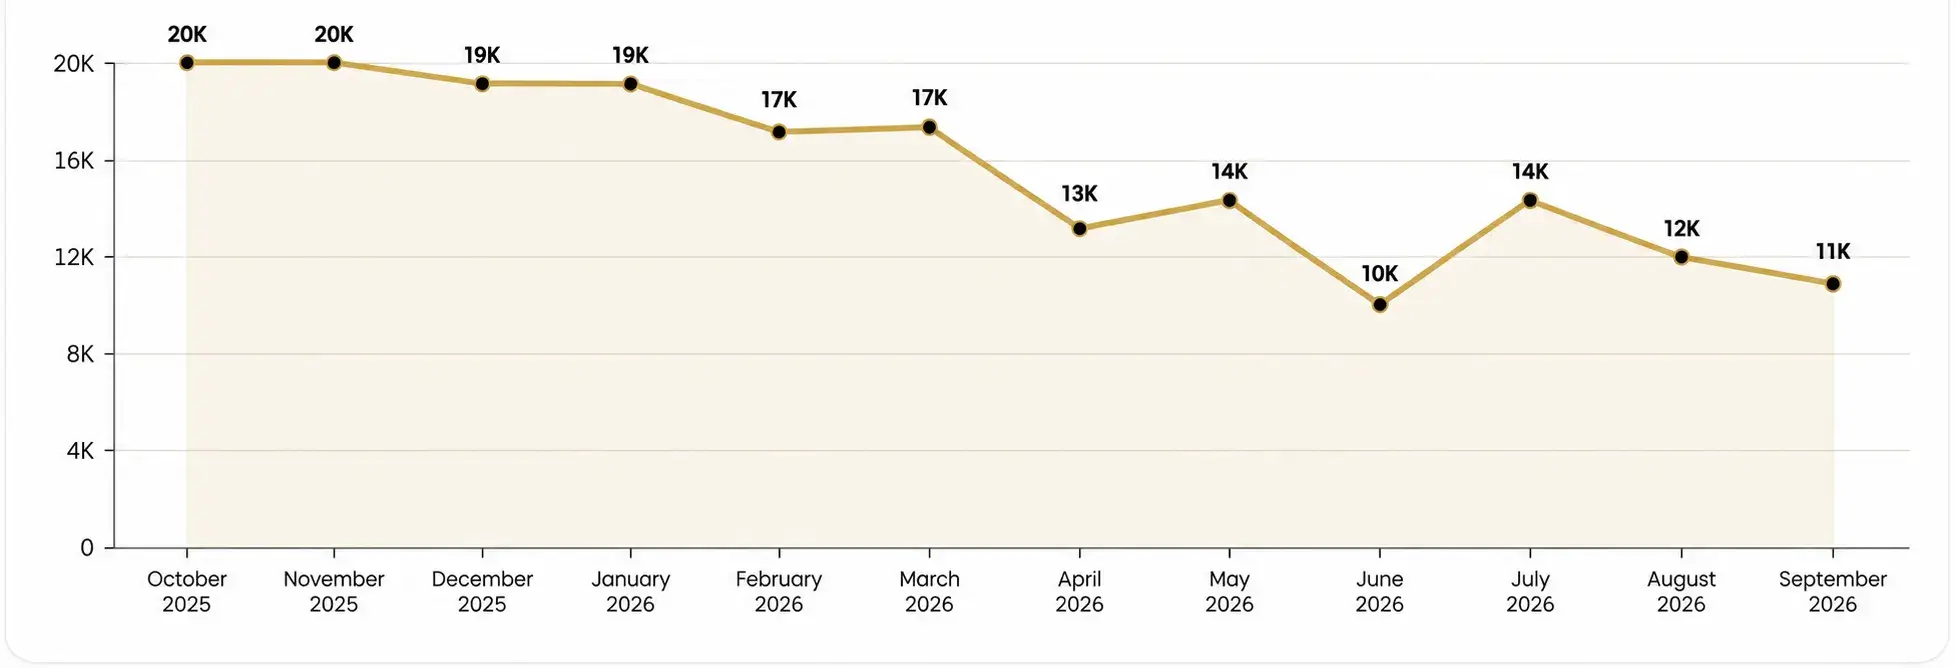
Monthly sales transactions, October 2025 – September 2026. Source: DLD / DXB Interact
Property Type
September Sales Volume by Property Type

Primary Market
Price Trends — Primary Market
Median price per square foot for newly launched (primary) stock.
| Type | Price / Sqft | vs. 2025 | vs. 2014 |
|---|---|---|---|
| Apartment | AED 1,703 | ▼ 4.8% | ▲ 32.3% |
| Villa | AED 1,318 | ▲ 3.5% | ▲ 70.3% |
| Plot | AED 300 | ▼ 66.8% | ▲ 397.1% |
Resale Market
Price Trends — Resale Market
Median price per square foot for secondary (resale) stock.
| Type | Price / Sqft | vs. 2025 | vs. 2014 |
|---|---|---|---|
| Apartment | AED 1,514 | ▲ 1.6% | ▲ 34.9% |
| Villa | AED 1,443 | ▼ 2.0% | ▲ 37.2% |
| Plot | AED 796 | ▲ 35.0% | ▲ 76.9% |
Rental Market
Rental Prices
Average annual rent by segment, versus September 2025.
| Segment | Avg. Annual Rent | vs. Sep 2025 |
|---|---|---|
| Apartment | AED 70,000 | ▼ 4.1% |
| Villa | AED 205,000 | ▼ 14.6% |
| Commercial | AED 115,500 | ▼ 16.6% |
Market Read
Rents are easing while sale prices remain steady.
Rents easing alongside steady sale prices is good news for yield-focused investors on the buy side, and a signal for landlords to price renewals realistically to keep good tenants.
Transaction Distribution
Where the Volume Is: Sales by Price Band
Share of 2026 sales volume by price band. Excludes mortgage transactions.
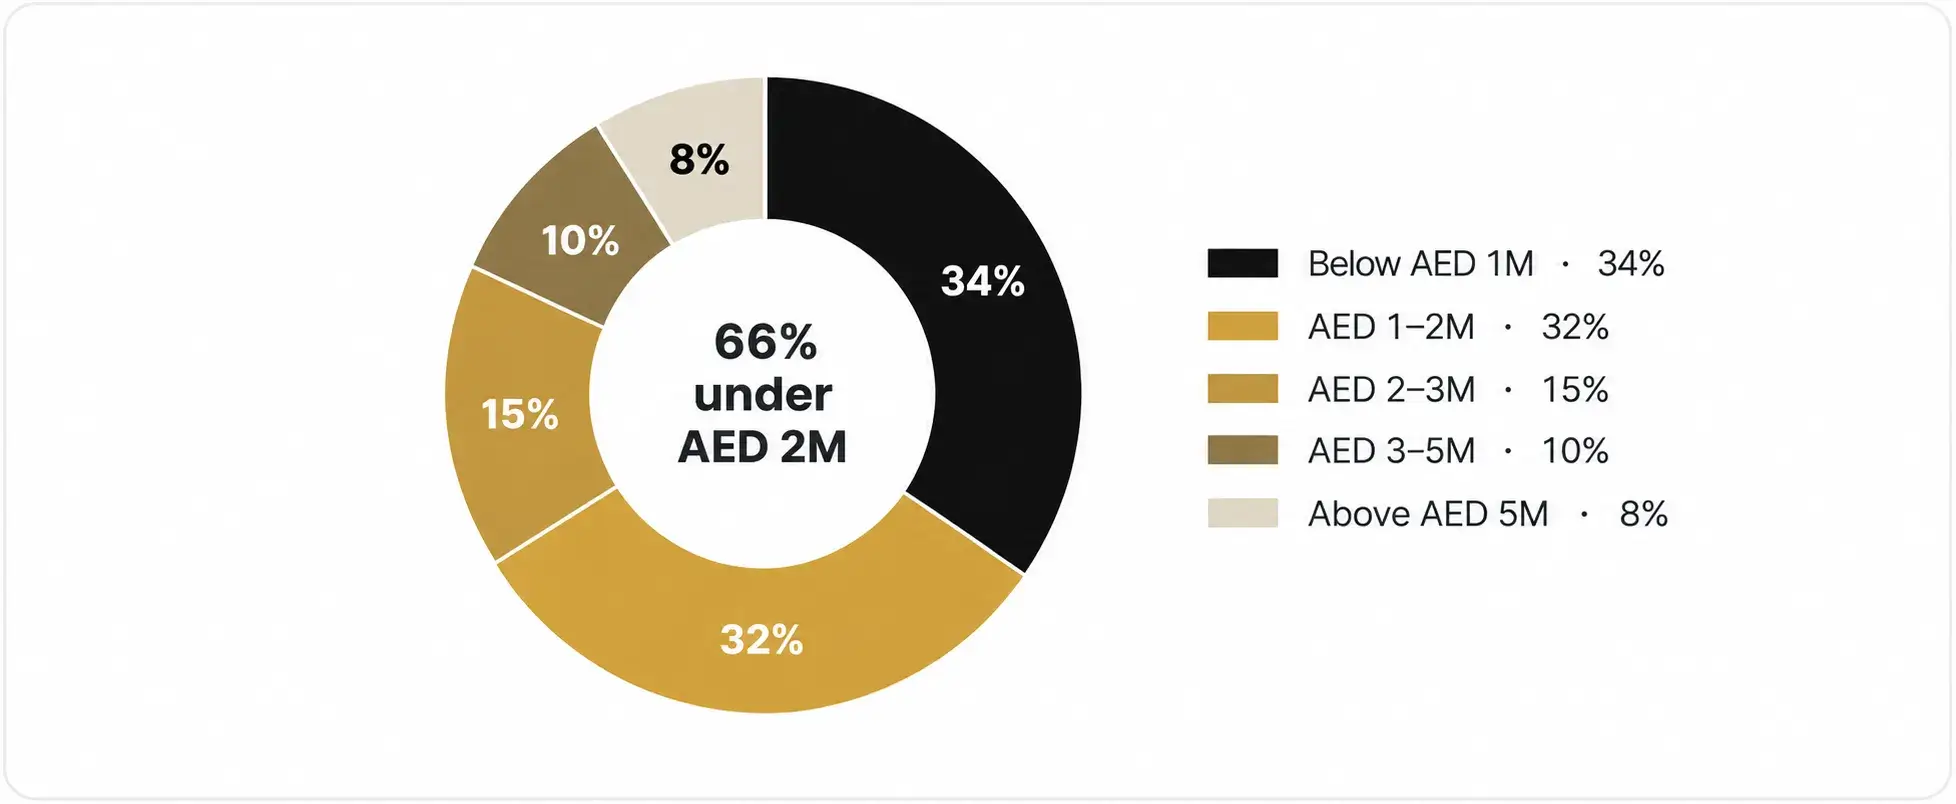
Sales value distribution by price category. Excludes mortgage transactions.
Market Insight
The affordability centre remains strong: 66% of sales value in the supplied category mix sits under AED 2M.
Geographic Activity
Top 5 Performing Areas (by Volume)
Leading Dubai areas by transaction volume in September 2026.
01
Dubai South
Clear volume leader for the month
02
Al Barsha South Fourth
Established Mid-market Apartment Demand
03
Wadi Al Safa 3
Villa led Residential Demand
04
Jebel Ali First
Strong mix of Plots & Residential Stock
05
Wadi Al Safa 5
Villa community with sustained activity
Financing Activity
Financing: Cash Dominates the Market
Mortgage activity continued to form an important part of Dubai’s transaction landscape in September.
| Metric | Value | MoM | YoY |
|---|---|---|---|
| Mortgage transactions | 4,038 | ▲ 7.2% | ▲ 6.5% |
| Mortgage value | AED 16.2B | ▲ 12.7% | ▲ 37.6% |
Financing Snapshot
Mortgage transactions increased 7.2% month-on-month and 6.5% year-on-year, while mortgage value reached AED 16.2B, up 12.7% MoM and 37.6% YoY.
Trophy Transactions
Dubai’s Top Luxurious Property Sales in September
The month’s highest-value apartment and villa transactions highlight the continued presence of ultra-luxury demand.
Top 5 Apartment Sales
| # | Price | Project / Area |
|---|---|---|
| 01 | AED 71M | Como Residences at Palm Jumeirah |
| 02 | AED 37M | Muraba Veil at Al Wasl |
| 03 | AED 37M | Mr C Residences Jumeirah – Block B3 at Jumeirah Second |
| 04 | AED 36M | Bluewaters Residences 3 at Marsa Dubai |
| 05 | AED 30M | Serenia Living – Tower 3 at Palm Jumeirah |
Top 5 Villa Sales
| # | Price | Area |
|---|---|---|
| 01 | AED 360M | Eome |
| 02 | AED 252M | Dubai Hills – Hills View Community |
| 03 | AED 128M | Emirates Hills |
| 04 | AED 110M | Signature Villas |
| 05 | AED 91M | Lanai Island |
Luxury Market Snapshot
Dubai’s luxury market remained active in September, alongside strong transaction volumes across the broader affordable and mid-market segments.
Project Activity
Best-Selling Projects
Leading primary and resale projects ranked by transaction volume.
Primary Apartments — by Volume
| Project | Volume | Value | Median Price |
|---|---|---|---|
| Valia – Tower | 263 | AED 725.4M | AED 2.3M |
| Binghatti Skyterraces | 252 | AED 238.3M | AED 840.5K |
| Binghatti Skyflame 1 | 226 | AED 162.7M | AED 570K |
| Raw District 2 By Imtiaz – Residential | 186 | AED 184.7M | AED 751.2K |
| Binghatti Skyflame 2 | 133 | AED 104.8M | AED 580K |
Primary Villas — by Volume
| Project | Volume | Value | Median Price |
|---|---|---|---|
| Greenz By Danube | 62 | AED 305M | AED 4.5M |
| Reportage Hills | 53 | AED 102.8M | AED 1.7M |
| The Greens At Sobha Sanctuary | 51 | AED 258.6M | AED 4.2M |
| DAMAC Islands 2 – Antigua 1 | 33 | AED 332.1M | AED 9.5M |
| DAMAC Islands 2 – Cuba | 29 | AED 166.4M | AED 5.8M |
Resale Apartments — by Volume
| Project | Volume | Value | Median Price |
|---|---|---|---|
| Dune Residency Dubai | 32 | AED 24M | AED 651.2K |
| Binghatti Apex | 31 | AED 24M | AED 680K |
| Regalia | 20 | AED 28.7M | AED 1.3M |
| Sobha Hartland – Crest Grande | 19 | AED 51.3M | AED 2.5M |
| Peninsula Four Tower A | 15 | AED 28.8M | AED 1.4M |
Resale Villas — by Volume
| Project | Volume | Value | Median Price |
|---|---|---|---|
| DAMAC Lagoons – Portofino | 16 | AED 49.6M | AED 2.6M |
| Mudon Al Ranim 6 | 16 | AED 62.9M | AED 4M |
| Mudon Al Ranim 5 | 16 | AED 65.3M | AED 4.1M |
| The Valley – Elora | 13 | AED 40.2M | AED 3.3M |
| Damac Lagoons – Costa Brava (2) | 12 | AED 37.4M | AED 2.7M |
Market Perspective
What This Means for You
Buyers
A more selective market gives buyers greater choice and negotiating room. With 66% of sales under AED 2M, affordable and mid-market properties remain the most liquid.
Investors
Accurate pricing matters more than ever. Apartment activity softened, while villas, commercial properties and plots showed stronger momentum. Well-priced properties remain better positioned to attract buyers.
Sellers
The market offers opportunities, but entry price and rental yield are key. Resale apartments remained relatively resilient, while plots recorded strong YoY growth despite softer rents across major segments.
Looking Forward
The Market Ahead
September points to a selective, value-driven market rather than a broad decline. Buyers have more room to negotiate, sellers need sharper pricing, and investors should focus on quality, liquidity and long-term fundamentals.